Graph Tab
This tab displays a graphical representation of the selected signals. The Graph tab offers two types of views: Single Graph View and Multi Graph View. You can choose between them using the right-click menu or the toolbar.
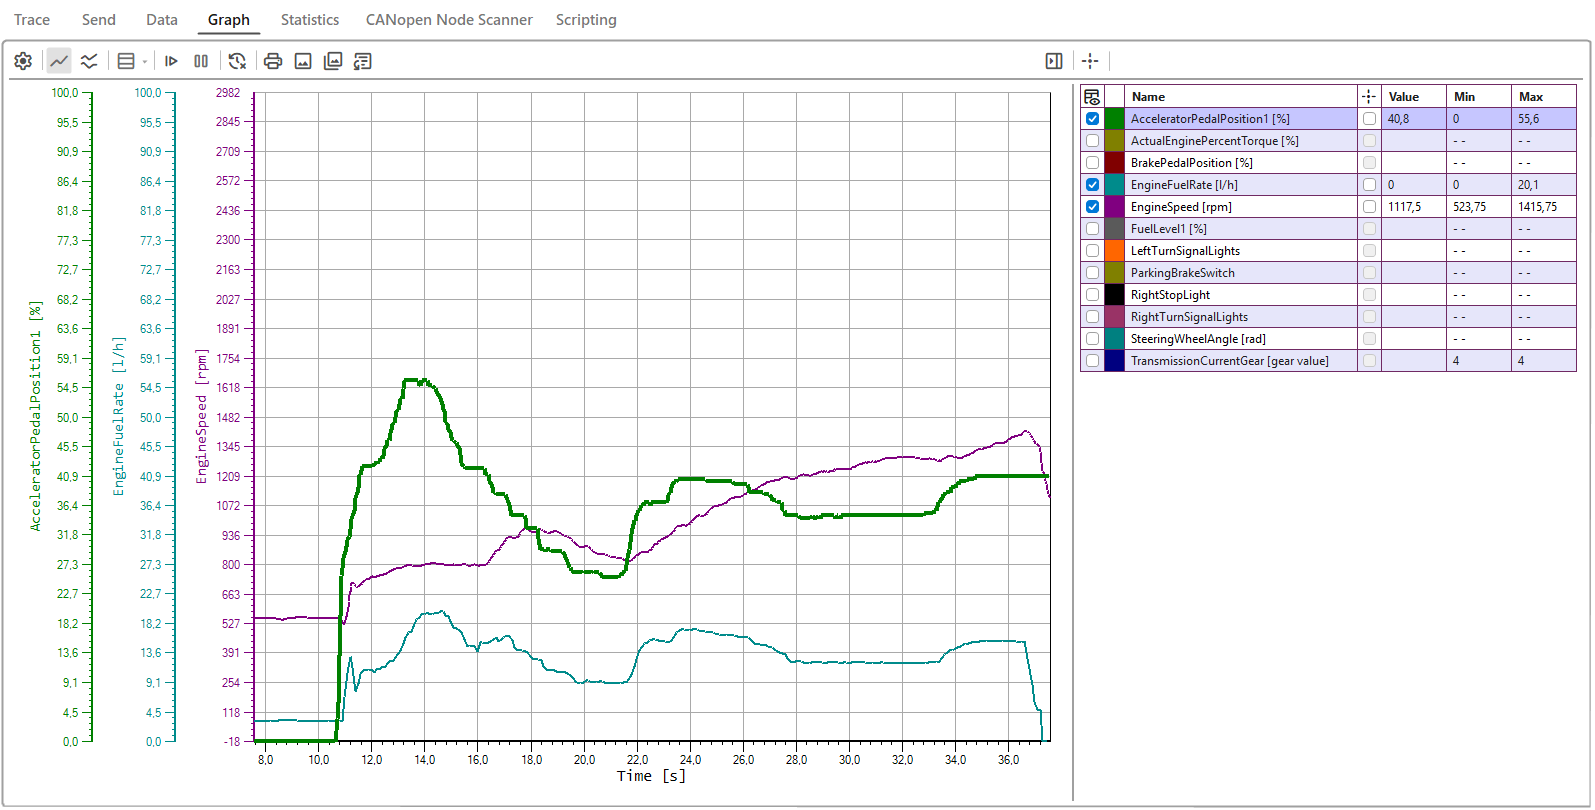
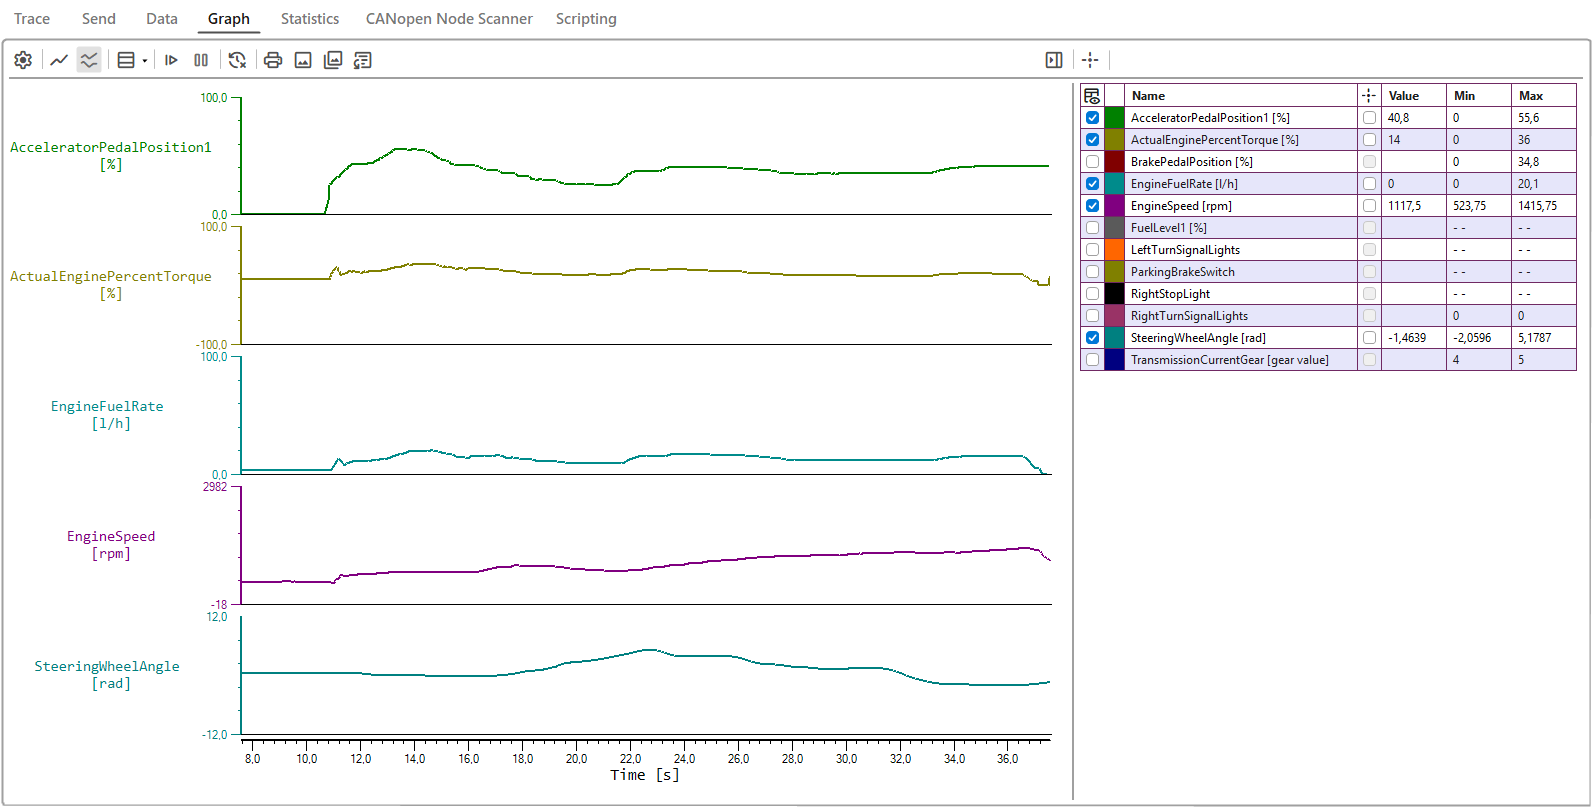
Graph Toolbar
| Icon | Description |
|---|---|
 |
Open the Configure Signals dialog |
 |
Open the single graph view |
 |
Open the multi graph view |
 |
Opens a drop-down to select how many signals maximum to be visible in multi-view, when the amount of visible configured signals exceeds this limit a scrollbar is shown. |
 |
Resumes tracking on all axes |
 |
Pauses tracking on all axes. The graph window will be paused while the drawing continues. |
 |
Clear data from all graphs |
 |
Open printing preview |
 |
Save the graph as image |
 |
Copy the graph as image to clipboard |
 |
Opens the Export Graph Data dialog |
 |
Collapse legend |
 |
Expand legend |
 |
Data-cursor, show/hide data-cursor feature for all signals |
When right-clicking on the Graph window, a menu appears (same menu in menu strip) with the following options:
Graph tab menu description
| Menu Name | Description |
|---|---|
| Configure Signals... | Open the Configure Signals dialog. |
| Open single graph view | Opens the single graph view if the current view is in multi-view. (The context menu is disabled in single view.) |
| Open multi graph view | Opens the multi-graph view if the current view is in single view. (The context menu is disabled in multi-view.) |
| Multi-view visible signals | Opens a drop-down to select how many signals maximum to be visible in multi-view, when the amount of visible configured signals exceeds this limit a scrollbar is shown. (Option only visible in multi-view) |
| Clear Data | Clears data from all graphs |
Configure Signals
Before adding a signal to the Graph tab, the user needs to add a database. Click here to see how to add a database.
To add, remove or configure signals, just right-click the Graph window and choose Configure Signals from the menu. The below dialog box will appear. On the top left of the dialog user can see how many signals they have configured.
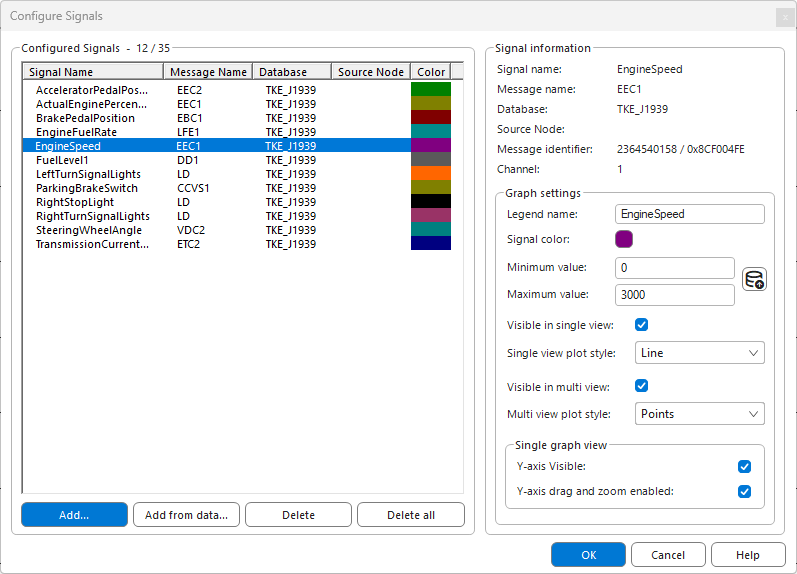
Each added signal has its own configuration. When a signal is selected, its information from the database will be displayed on the right side of the window.
- Signal Name: The original name of the signal as defined in the database.
- Message Name: Shows the name of the parent message associated with the selected signal in the database.
- Database: The name of the database of the signal.
- Source Node: Indicates the name of the source node for the signal.
- Message Identifier: Message identifier for the signals message.
- Channel: The software channel in CANtrace to which this database is assigned to.
Configure Signals Form Description
| Name | Description |
|---|---|
| Add... | Add signals from the associated database |
| Add from data... | Add the configured signals from the Data tab if there are any |
| Delete | Delete the chosen signals |
| Delete all | Delete all signals on the configured signals list |
| Legend Name: | Signal name that is editable. You can define your own name of the signal that will be shown graphically. E.g. the signal name is EngSpeed, you can define rpm as the legend name. NOTE! Doesn't change the database! This doesn't change the original associated database file, it only changes the name shown on graph window |
| Signal Color: | Configure the color shown for the signal in the graph. |
| Minimum value: | Configure the minimum value for the signal's y-axis in the graph. |
 |
Pull minimum and maximum values from the database for the signal. |
| Maximum value: | Configure the maximum value for the signal's y-axis in the graph. |
| Visible in single view: | Configure to show/hide the selected signal in single graph view. To display the signal, open Configure Signals dialog and check the box or enable signal from the Legend . |
| Single view plot style: | How the selected signal is drawn in single graph view: Line, Points (data points only, without the connecting line) or Line + Points. |
| Visible in multi view: | Configure to show/hide the selected signal in multi graph view. To display the signal, open Configure Signals dialog and check the box or enable signal from the Legend . |
| Multi view plot style: | How the selected signal is drawn in multi graph view: Line, Points or Line + Points. |
| Y-axis Visible: | Configure to show/hide the y-axis for the selected signal in single graph view. To display the y-axis again, open Configure Signals dialog and check the box. |
| Y-axis drag and zoom enabled: | Configure to enable/disable drag and zoom in the single graph view. |
Add Signals
This dialog box allows adding signals to the Configure signals window, which in turn allows monitoring their runtime values in the Data tab and the Graph tab. Once one or more databases have been associated with the project, all the signals and messages in those databases become available in the tree-view on the left side.
The figure below illustrate the graphical layout of the Add Signal dialog box and the buttons available to the user.
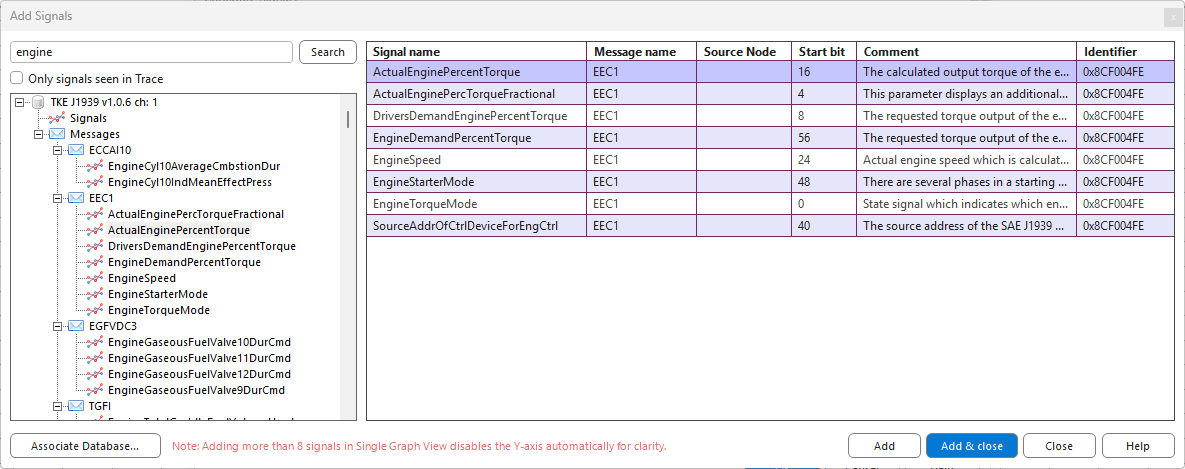
Use the search box to filter messages and signals by name, or check Show only signals seen in Trace to limit the tree-view to signals that are on the bus. See Add Signal for details.
While opening Add Signals when in Graph tab, red colored note will appear. This reminds user about automatical Y-axis visibility disabling for clarity. User can manually change visibility to their needs in Configure Signals dialog.
Export graph data
This dialog allows export of the data in the graph from a selected timespan to Vector ASCII log file, Vector Binary Log File or CSV file. To adjust the timespan drag the cursors of the two trackbars or write the desired timestamp in the textboxes.
The textboxes accepts time in the following formats:
- Seconds - e.g. 300 or 00:59
- Minutes - e.g. 59:00
- Hours - e.g. 23:00:00
- Days - e.g. 01:00:00:00
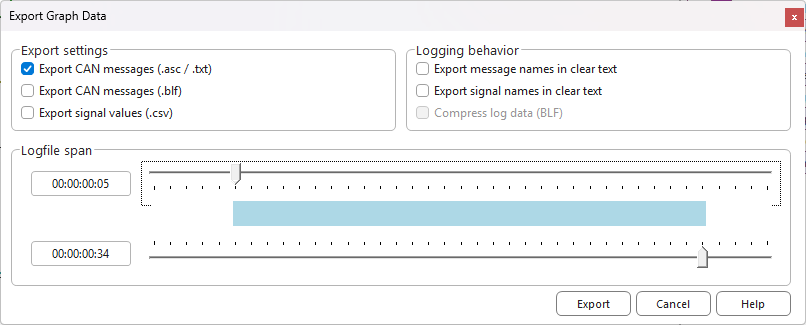
Export Graph Data Form Description
| Name | Description |
|---|---|
| Export CAN messages (.asc / .txt) | Exports the graph data as Vector ASCII log file. |
| Export CAN messages (.blf) | Exports the graph data as Vector Binary Log File. |
| Export signal values | Exports the graph data as CSV file. |
| Export message names in clear text | (Only available when exporting in Vector ASCII format) Writes the names of the CAN messages in clear text as a comments to the log file. |
| Export signal names in clear text | (Only available when exporting in Vector ASCII format) Writes the names and values of the signals in clear text as a comments in the log file. |
| Compress log data (BLF) | (Only available when exporting in Vector BLF format) Applies compression to the exported log data to decrease file size. |
Data Cursor
Once you have enabled the Data Cursor in the Legend for wanted signals, you will be able to see the data cursor for these. As seen in the figure below, you can configure the display mode for the selected cursor by right-clicking on the signal in the legend.
You can also change the location of the value on the cursor by dragging it to the location you want (left click mouse and hold to drag) in single graph view. In multi graph view the cursors nor the hint-boxes cannot be moved.
Data cursor values are taken from each respective axis with the same precision (decimal amount).
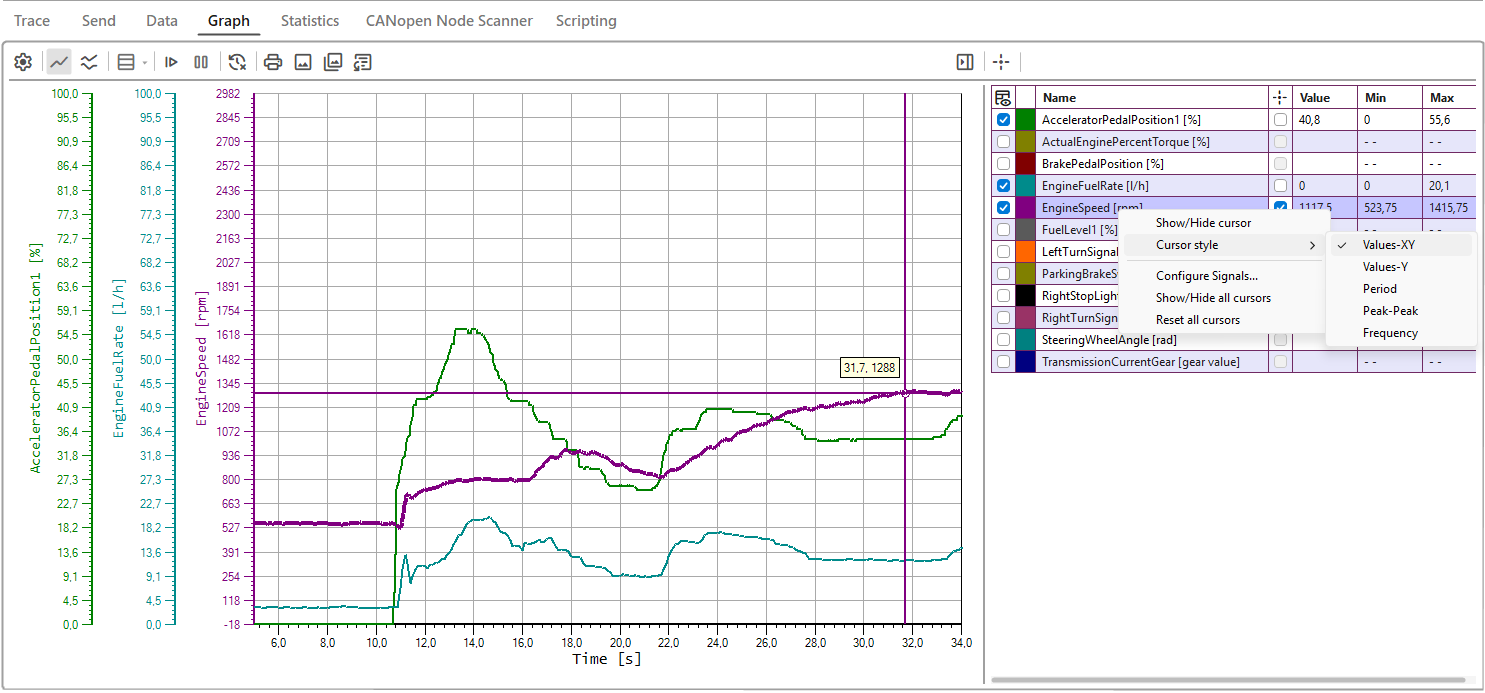
Data Cursor Description
| Name | Description |
|---|---|
| Show/Hide cursor | To show/hide the chosen cursor. The cursor will be shown again if you disable and enable Data Cursor button on the toolbar. |
| Cursor style | To change the display style of the data cursor. You can configure to display only y-axis value or XY-values and you can measure period, peak to peak and frequency of the signal. |
| Show/Hide all cursor | To show/hide all previously used data cursors. |
| Reset all cursors | To reset all of the datacursors to initial position and type, and hiding them all. |
Legend
The Legend window displays the configured signals and enhances the functionality of the graph. It also includes its own context menu for additional options. The graph window legend provides the following features:
Legend Description
| Column Name/Icon | Description |
|---|---|
 (Show / Hide Signal) |
Toggles the visibility of the signal. Behavior differs between single-view and multi-view. |
| " " (Signal Color) | Displays the assigned color for the signal. It can be customized in the Signal color field of the Configure Signals dialog. |
| Name | By default, this is the signal name. It can be customized in the Legend name field of the Configure Signals dialog. |
| (Show / Hide Data Cursor) |
Toggles the visibility of the data cursor. Behavior differs between single-view and multi-view. |
| Value | Displays the real-time current value. |
| Min | Displays the real-time minimum value. |
| Max | Displays the real-time maximum value. |
Zoom
By using the mouse, it is possible to zoom, both vertically and horizontally. Click on the axis you want to zoom and hold down the Ctrl key. Use the mouse wheel for actual zooming.
If you only want to move on the axes or move the signals just grab the axis and then scroll or move your mouse.
Zooming in or out on the y-axis changes the precision (decimal amount) displayed on the y-axis. Decimals are added or decreased to fit the y-axis values. Still each y-axis has a maximum precision taken from the associated database that can’t be exceeded.