Trace Tab
This tab displays all the messages on the CAN bus. Multiple functionalities are available to portrait data in different ways.
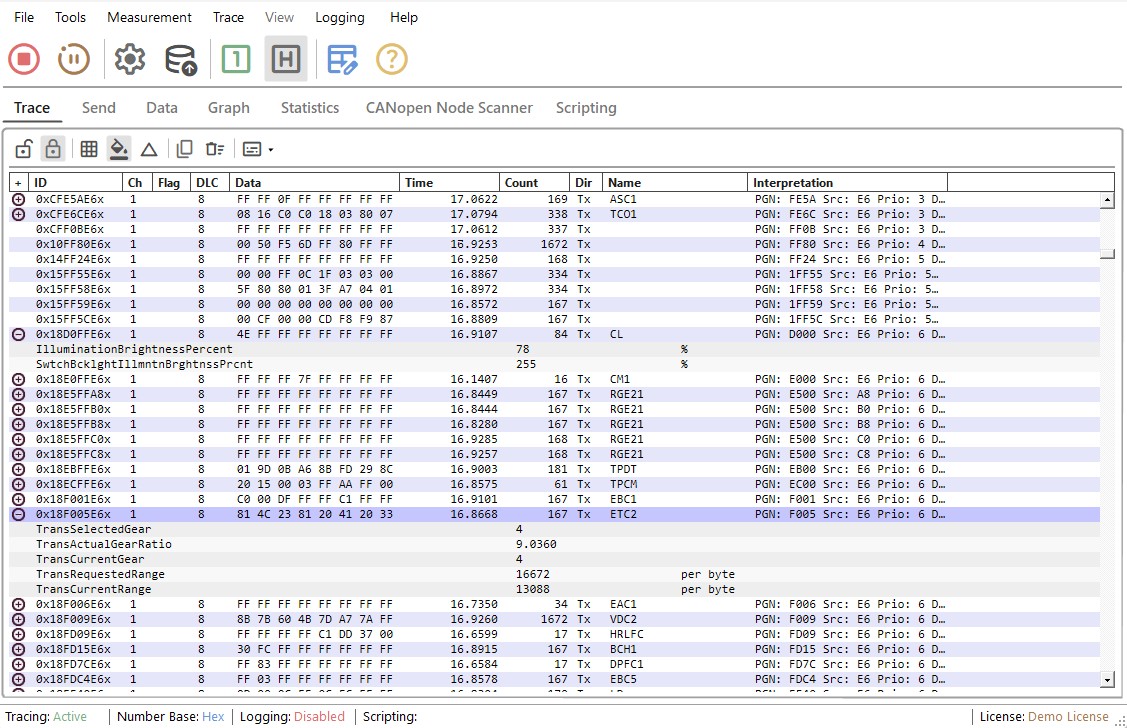
The toolbar provides quick access to the main data window functions. These can be accessed from right-click menu or from top menu.
| Icon | Description |
|---|---|
 |
Show Grids: Displays the grids in the trace window |
 |
Fixed View: For all messages with the same ID, Ch, and Dir, only one line is displayed. Only the latest message received is shown |
 |
Delta Time: Enabled when Fixed View is enabled. The time column displays the time interval between the two latest messages with the same ID, Ch, and Dir |
 |
Clear Data: Clears all data in the current trace window |
 |
Copy to Clipboard: Enabled when Off Bus. Copies the latest 1000 received messages to the clipboard |
 |
Show Colors: Enables the row background coloring |
 |
Interpretation: Displays the selected protocol message interpretation in the interpretation column |
Trace Message Columns
| Column Name | Column Description |
|---|---|
| ID | Displays the CAN identifier. An "x" is added to the end of the identifier if it's an extended ID |
| Ch | Displays software channel message is related to |
| Flag | Displays CAN frame flags: Empty (Classic CAN), F (CAN FD), FB (Bit Rate Switch), FBE (Error flag) |
| DLC | Displays the data length of the CAN message |
| Data | Displays the data of the CAN message received |
| Time | Displays message reception time. In Fixed View with Delta Time enabled, this shows the interval between the two latest matching messages |
| Count | Displays how many times a message has been received |
| Dir | Shows direction: Tx (sent from CANtrace) or Rx (received from bus) |
| Name | Shows the name of the message from the associated database file |
| Interpretation | Displays the selected protocol interpretation |
Sort
In Fixed View, messages can be sorted by any column in both off-bus and on-bus states.
- Default: Messages are sorted by ID in ascending order.
- Custom Sort: Click any column header (Channel, Flag, DLC, Data, etc.) to sort.
- Toggle: Subsequent clicks on the same header order between ascending and descending order.
- Reset: Going on bus resets any previously set sort order to the default.
Fixed View Database Signals
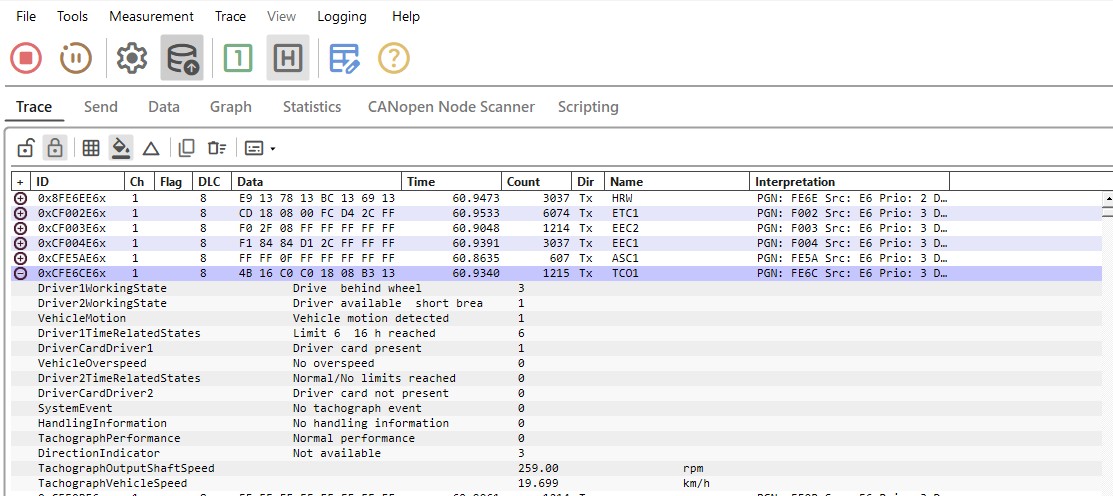
If a database (DBC) is associated with a software channel, the signal data will also display in the fixed view of the trace tab.
- Expansion: Messages with database entries feature a plus sign (+). Clicking this opens the signal list below the message.
- Ordering: Signals are sorted in ascending order according to their start bit.
- Values: Signals show physical values with scaling and units from the database.
- Value Tables: If a signal has a value table, the corresponding text description is displayed.
- Notation: Scaled values use a specific number of decimals. If a value is too long, it is shown in either fixed-point or scientific notation to remain compact.
Timestamps
Timestamps for received and transmitted messages begin from zero after going on bus.
- Resolution: 0.0001 seconds in the trace window; six fixed decimal digits are recorded in log files.
- Hardware Support: If a specific CAN interface does not support hardware timestamps, the timestamp is generated by the PC clock. Refer to the Interface Settings section to verify hardware support.
DTC Decoding
When decoding a signal where the J1939 database contains the attribute SigType=DTC (Diagnostics Trouble Codes), the trace window decodes those signals to show:
- SPN (Suspect Parameter Number)
- FMI (Failure Mode Identifier)
- OC (Occurrence Count)
- Text representations for the SPN and FMI.